On November 2 we split our own homepage four ways. Every visitor to fackt.io gets one of four versions, keeps it on every return visit, and our stats page shows how each one does.
Fifteen days later, 176 visits have landed on the homepage. None of the four versions has won. And the honest answer is that none can yet, and at our traffic none will for months.
With little traffic, an A/B test cannot pick a winner quickly. It can still teach you a lot, if you test bigger differences, measure an earlier signal and decide in advance when to stop. This is what we set up, what the numbers show so far, and what we would tell any founder about to test their own homepage.
The four versions
We did not test button colors. Each version is a different idea of what a visitor needs first:
- A, current. The full homepage: an ask bar in the hero, logos, who we work with, services, process, proof, pricing and a contact form.
- B, simpler. The same design with much less on it: a plain headline, results right under the hero, four projects, one line per service and one button everywhere.
- C, work first. A short hero that names the problem, then case studies straight away, followed by proof, services and pricing.
- D, reel and calendar. A showreel at the top, a wall of reviews and a calendar to book a call without leaving the page.
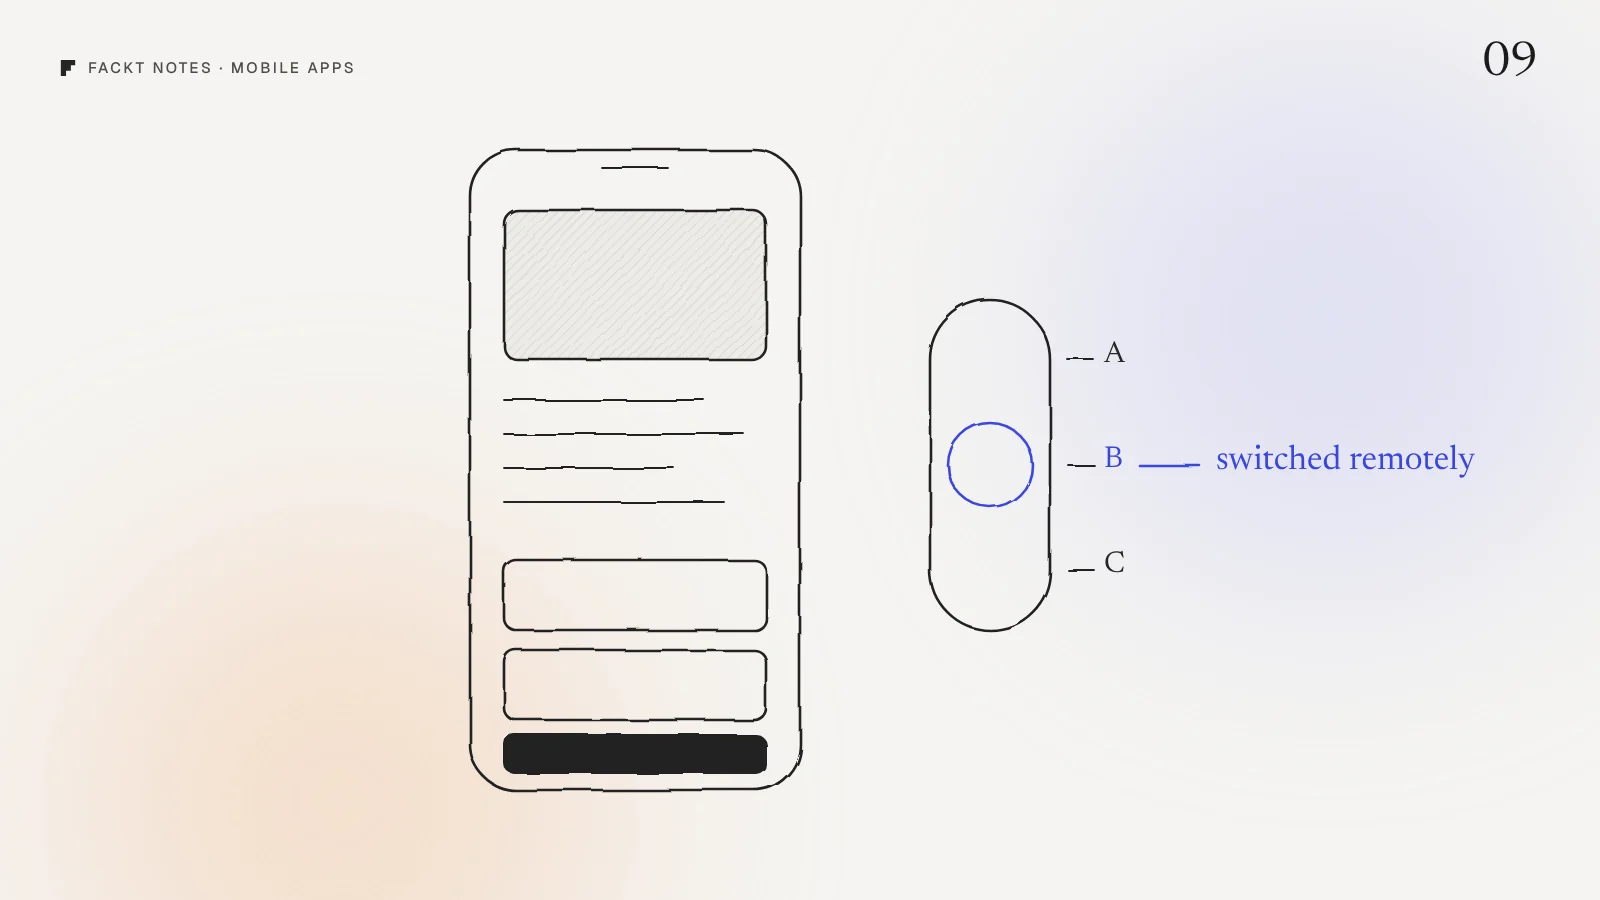
All four live at the same address. A small piece of code at the edge of the network picks a version for each new visitor, sets a cookie so they keep seeing it, and tags every page they view with the version. No flicker, no second address, nothing for search engines to get confused about.
What 15 days of numbers look like
| Version | Visits | Kept browsing | Pages per visit |
|---|---|---|---|
| A, current | 50 | 30% | 1.76 |
| B, simpler | 41 | 27% | 1.46 |
| C, work first | 40 | 33% | 1.80 |
| D, reel and calendar | 45 | 33% | 2.24 |
“Kept browsing” means the visitor opened at least one more page after the homepage. Bookings are too rare to compare yet, a handful across all four.
It is tempting to read this table. D gets the most pages per visit, B looks weakest, C and D tie on keeping people around. A founder looking at this on a Monday morning would want to switch to D.
Why 30% against 33% means nothing yet
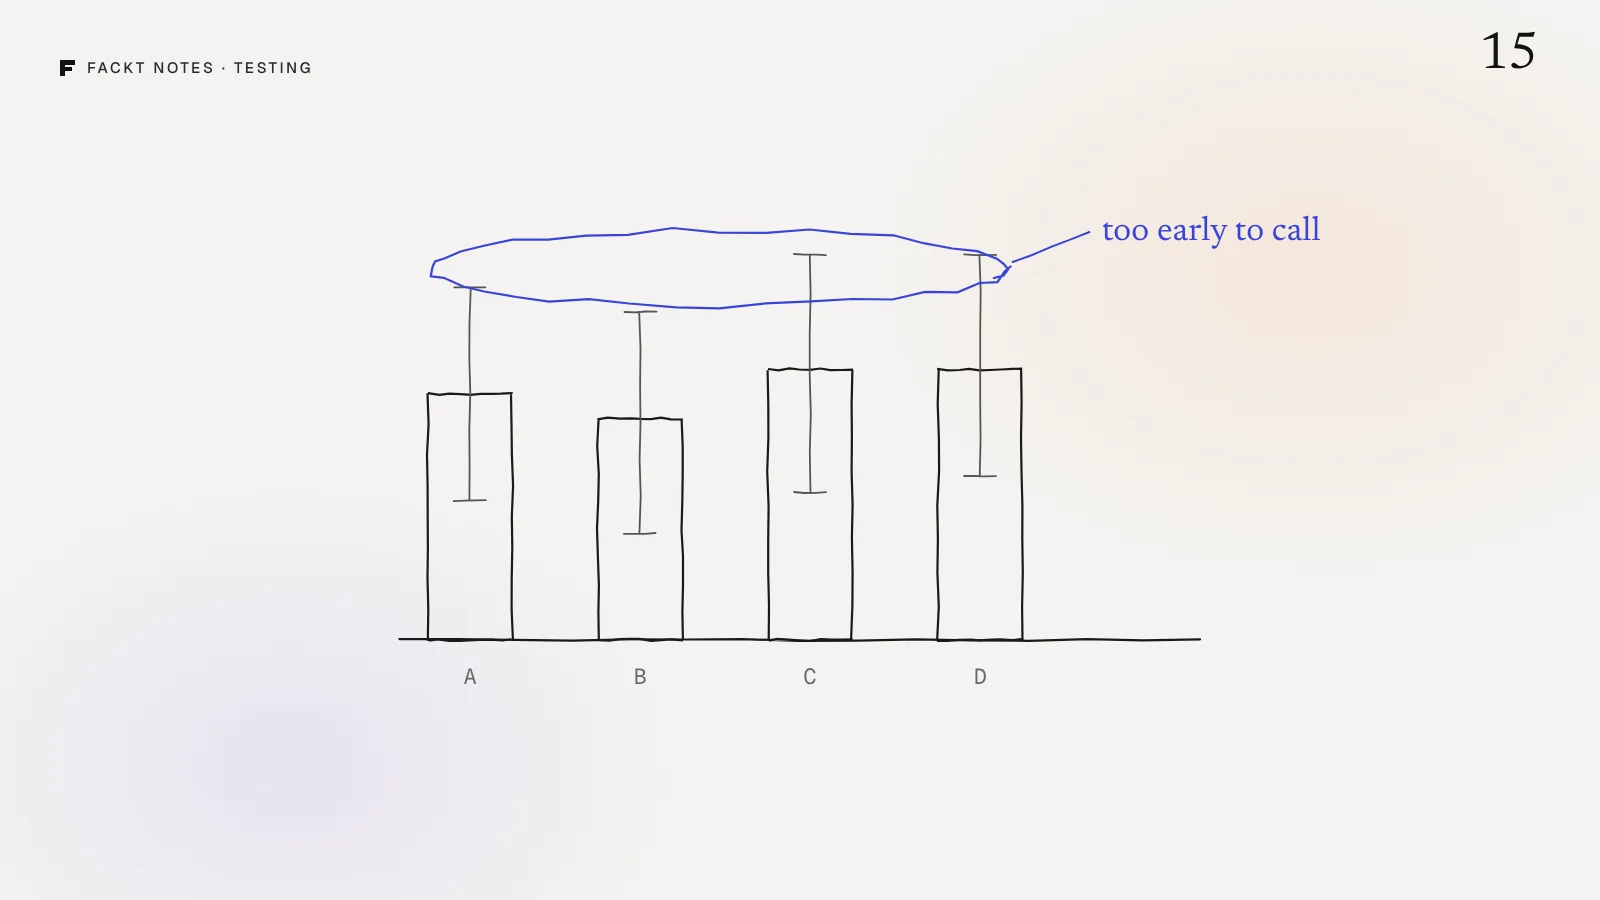
With 40 or 50 visits per version, every number in that table is a rough range, not a measurement. A’s 30% could really be anything from about 17% to 43%. C’s 33% could be 18% to 47%. The ranges overlap almost completely.
Run the same test again next fortnight and the order could easily flip. The table is not telling us which page is better. It is telling us we do not know yet.
How many visitors you actually need
The number of visitors you need depends on how big a difference you want to be able to see:
| You want to tell apart | Visitors per version |
|---|---|
| 30% against 40% kept browsing | about 356 |
| 30% against 36% kept browsing | about 963 |
| 1% against 2% booked a call | about 2,300 |
| 2% against 3% booked a call | about 3,800 |
That is with the usual standard: a 1 in 20 chance of calling a winner that is not real, and an 80% chance of spotting a difference that is.
Our homepage gets about 12 visits a day, so each of four versions gets about 3. Reaching 356 per version takes about four months. Comparing booking rates would take years. This is normal for an early SaaS site, and it is why most testing advice, written by teams with thousands of visitors a day, does not fit.
What to do when traffic is low
You can still test. You just have to set the test up for the traffic you have.
- Test big differences. A new headline color will never show up at 12 visits a day. A different first screen might. Each of our versions answers a different question: does the visitor want proof, less to read, the work, or a fast way to book?
- Measure an earlier step. Bookings are the goal, but they are too rare to compare. Pick a step that happens far more often and leads to bookings: opening a second page, scrolling to the work, clicking a case study, starting the form.
- Run two versions, not four. Every extra version splits your visitors again. Four versions made our test four times slower than it needed to be for any one comparison. Start with your current page against one bold alternative.
- Watch what people do, not just the totals. With low traffic you can afford to look at every visit. Where do they stop scrolling? What do they click first? Ten session recordings often explain a number better than a month of waiting.
- Decide when you stop before you start. Write down the step you measure and the number of visitors per version. Stop when you reach it, not when one version happens to look good. Checking every morning and stopping on a good day is the most common way to pick the wrong winner.
What we are changing
Based on this, we are not crowning a winner. We are making the test faster: once each version has 100 visits, the weakest one on kept browsing comes out, so the remaining ones get more traffic. And we are watching recordings of the visits that left after the first screen, version by version, because that is where the next idea will come from.
When to bother at all
If your site gets fewer than about 1,000 visitors a month, a formal A/B test will rarely give you a clear answer. Make your best change, watch what visitors do, and compare month to month. From around 3,000 a month, a two-version test on one bold change can give you an answer in a few weeks.
Either way, the setup is worth having before you need it. Once versions are served from the same address and every visit is tagged, starting the next test is a one-line change instead of a project.
Why this is hard to see from the inside
You built your homepage, so you read it the way you meant it. Visitors skim it in a few seconds and leave with whatever the first screen told them. A test with good numbers shows you which first screen works. Before you have the numbers, a fresh pair of eyes is the fastest way to know which bold change is worth testing.
We look at exactly that in the free audit: a video walkthrough of your homepage and a written list of fixes, ordered by impact, within 2 days.
Quick answers
How much traffic do you need to A/B test a homepage?
It depends on how big a difference you want to detect. To tell 30% of visitors keeping browsing from 40%, you need about 356 visitors per version. To tell a 1% booking rate from 2%, you need about 2,300 per version. Most early SaaS sites get there in months, not days.
Is A/B testing worth it for a small SaaS site?
Yes, if you test big differences and measure an early signal, like how many visitors keep browsing, instead of only bookings or signups. Small tweaks like button colors will not show up in your numbers at low traffic.
How many versions should a low traffic A/B test have?
Two. Every extra version splits your visitors further and makes the test take longer. Start with your current page against one bold alternative, and keep a third idea for the next round.
What should you measure when bookings are too rare to compare?
An earlier step that happens far more often and leads to bookings: visitors who open a second page, scroll to the work, click a case study or start the contact form. Pick it before the test starts, not after you see the numbers.