Tidewire
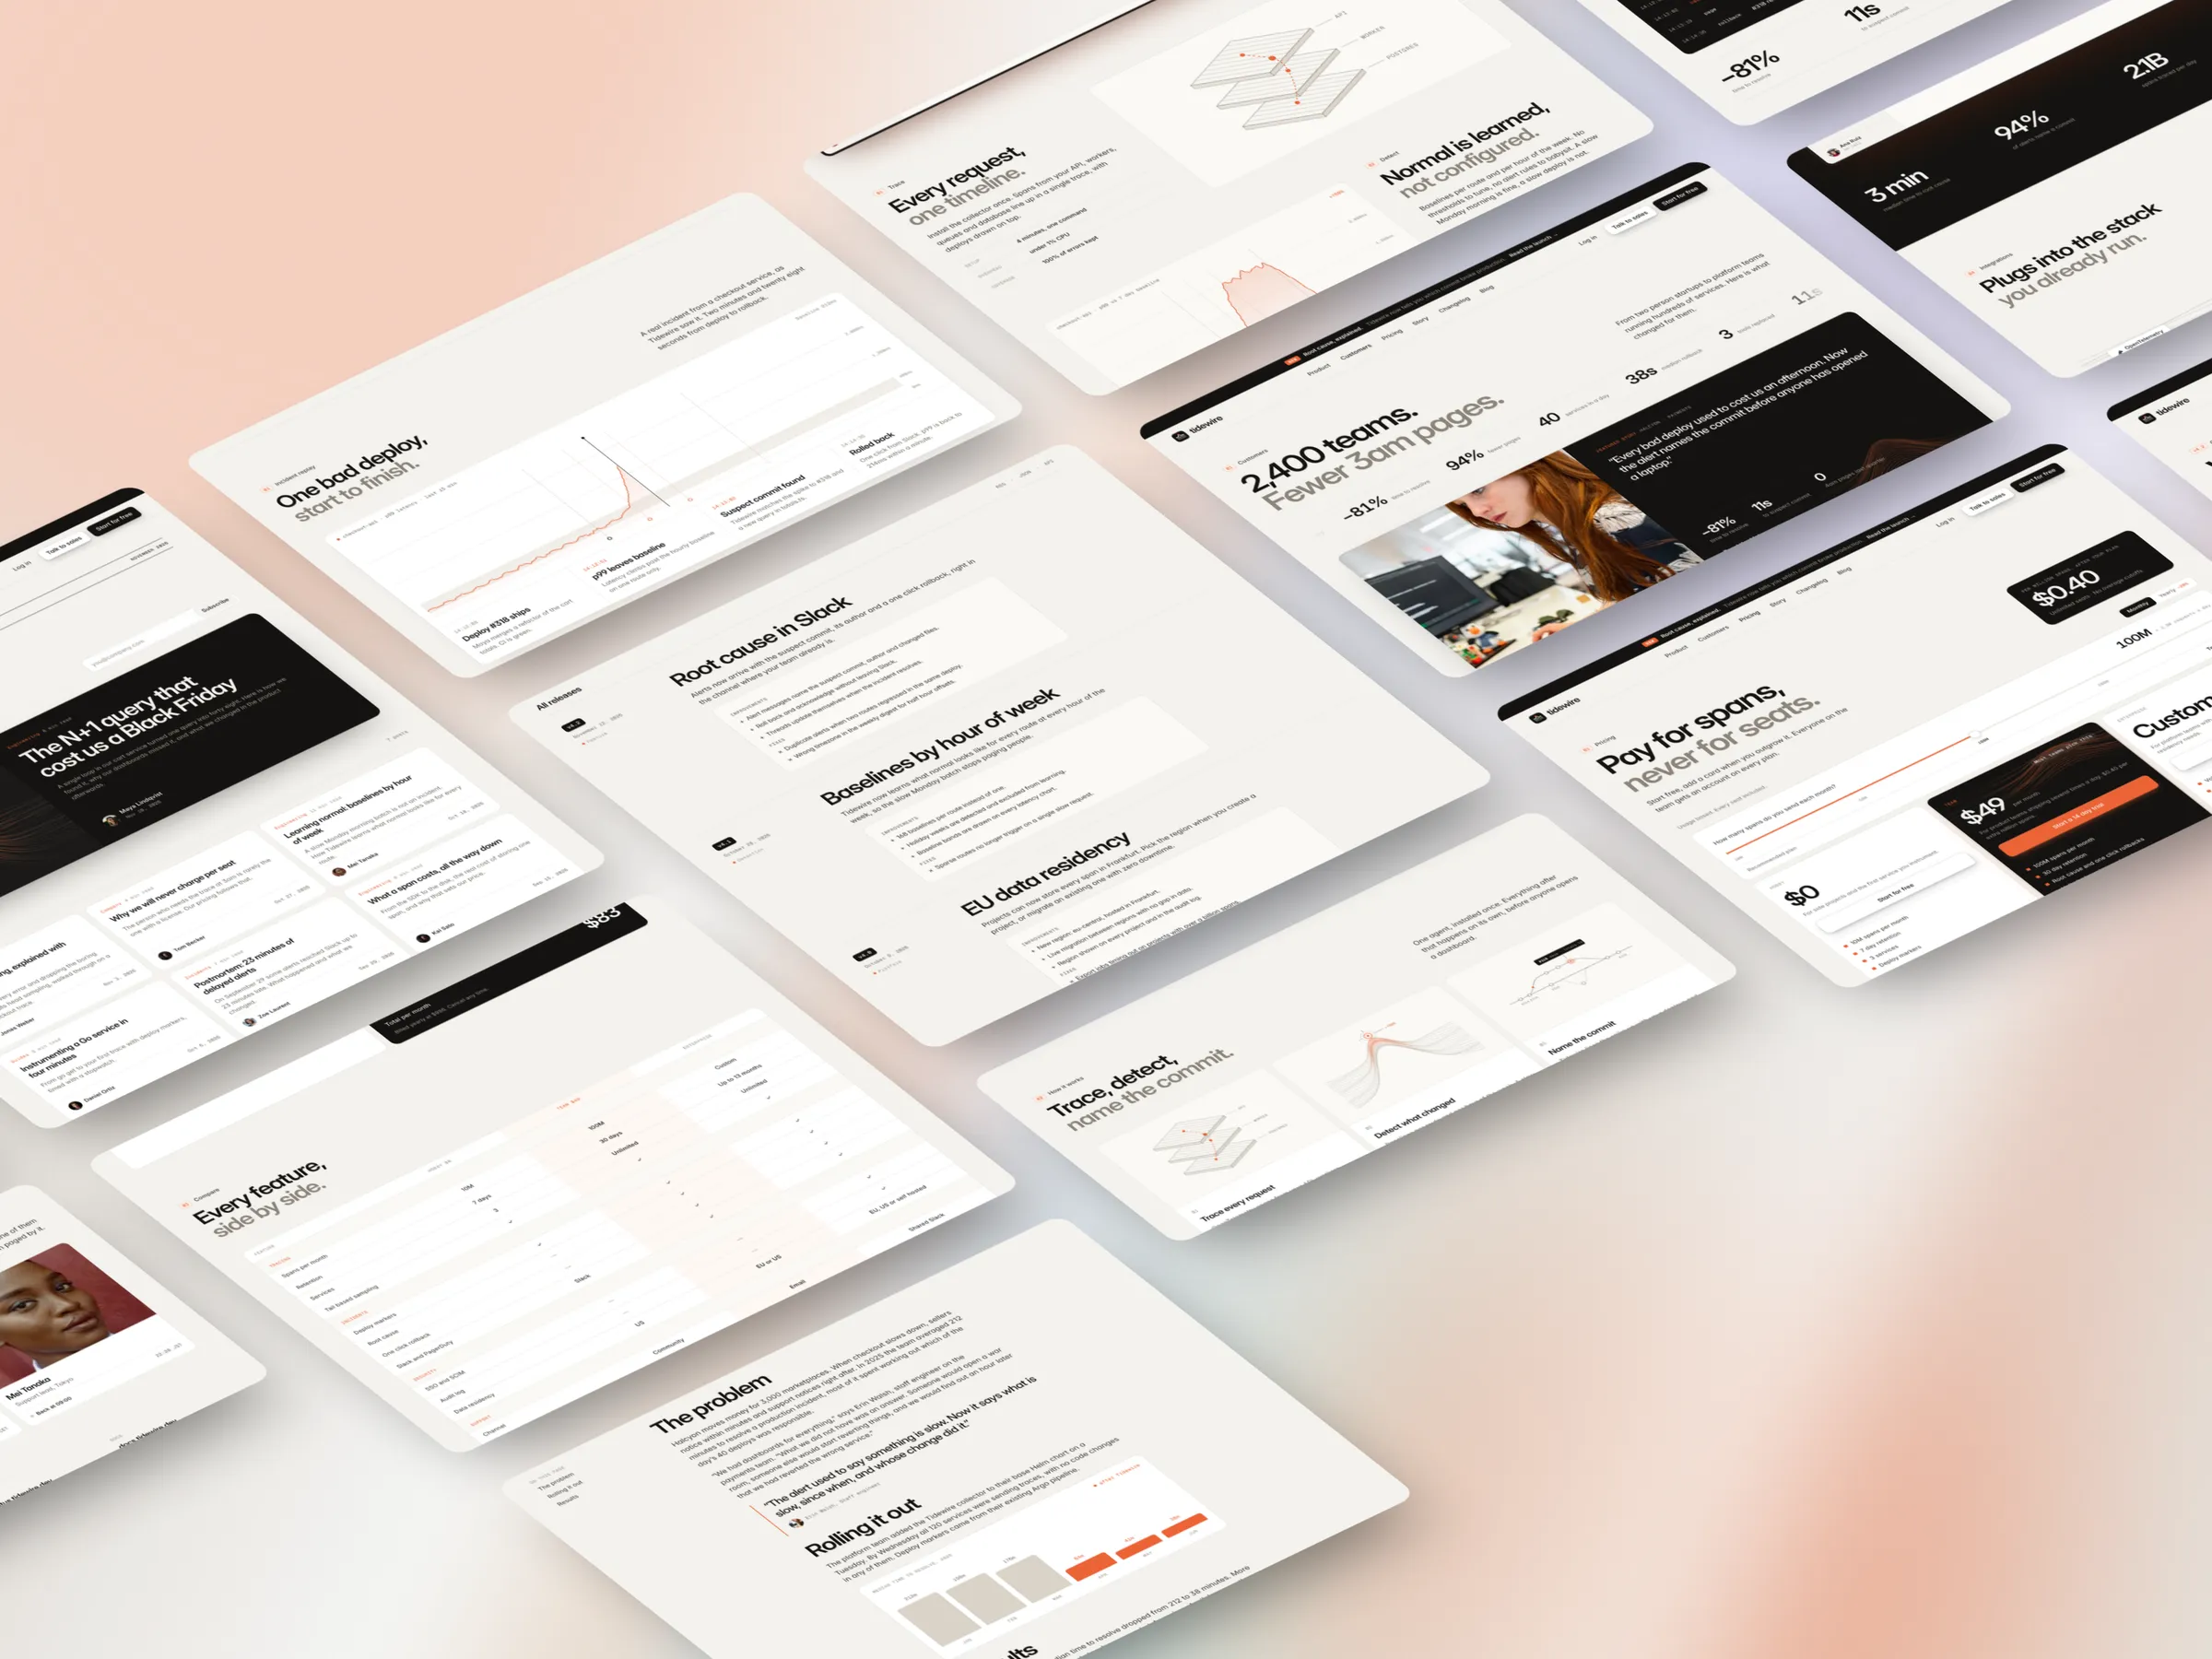
A landing page for a deploy and observability tool: the hero shows the moment production breaks, and one incident page proves the product. Figma to Framer.
See also: Meridian, web design and framer development →TradoxVPS, web design and motion →Free audit of your product →
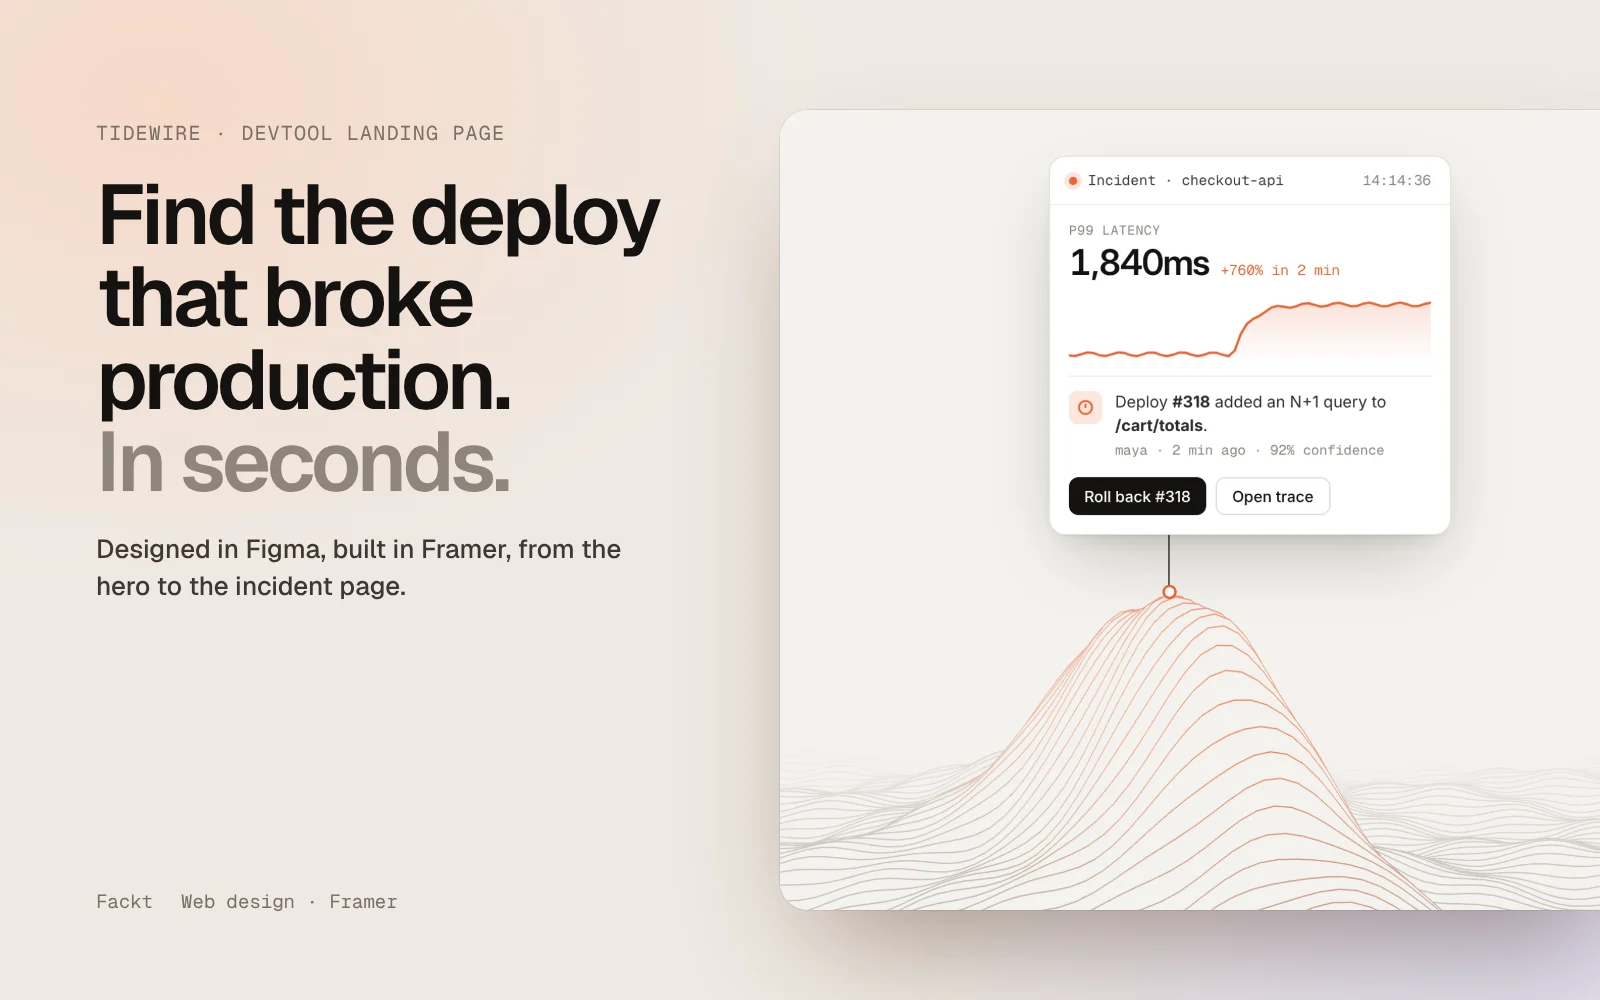
Selling something engineers only notice when it breaks
Deploy and observability tools sell something invisible. Nobody wakes up wanting traces, they want to know why checkout got slow at 2 AM and how to fix it before the next call.
Most devtool sites answer with logos, a dashboard screenshot and "full stack visibility". Engineers skim that in seconds and leave, because it looks like every other tool they already pay for.
Show the moment, then prove it
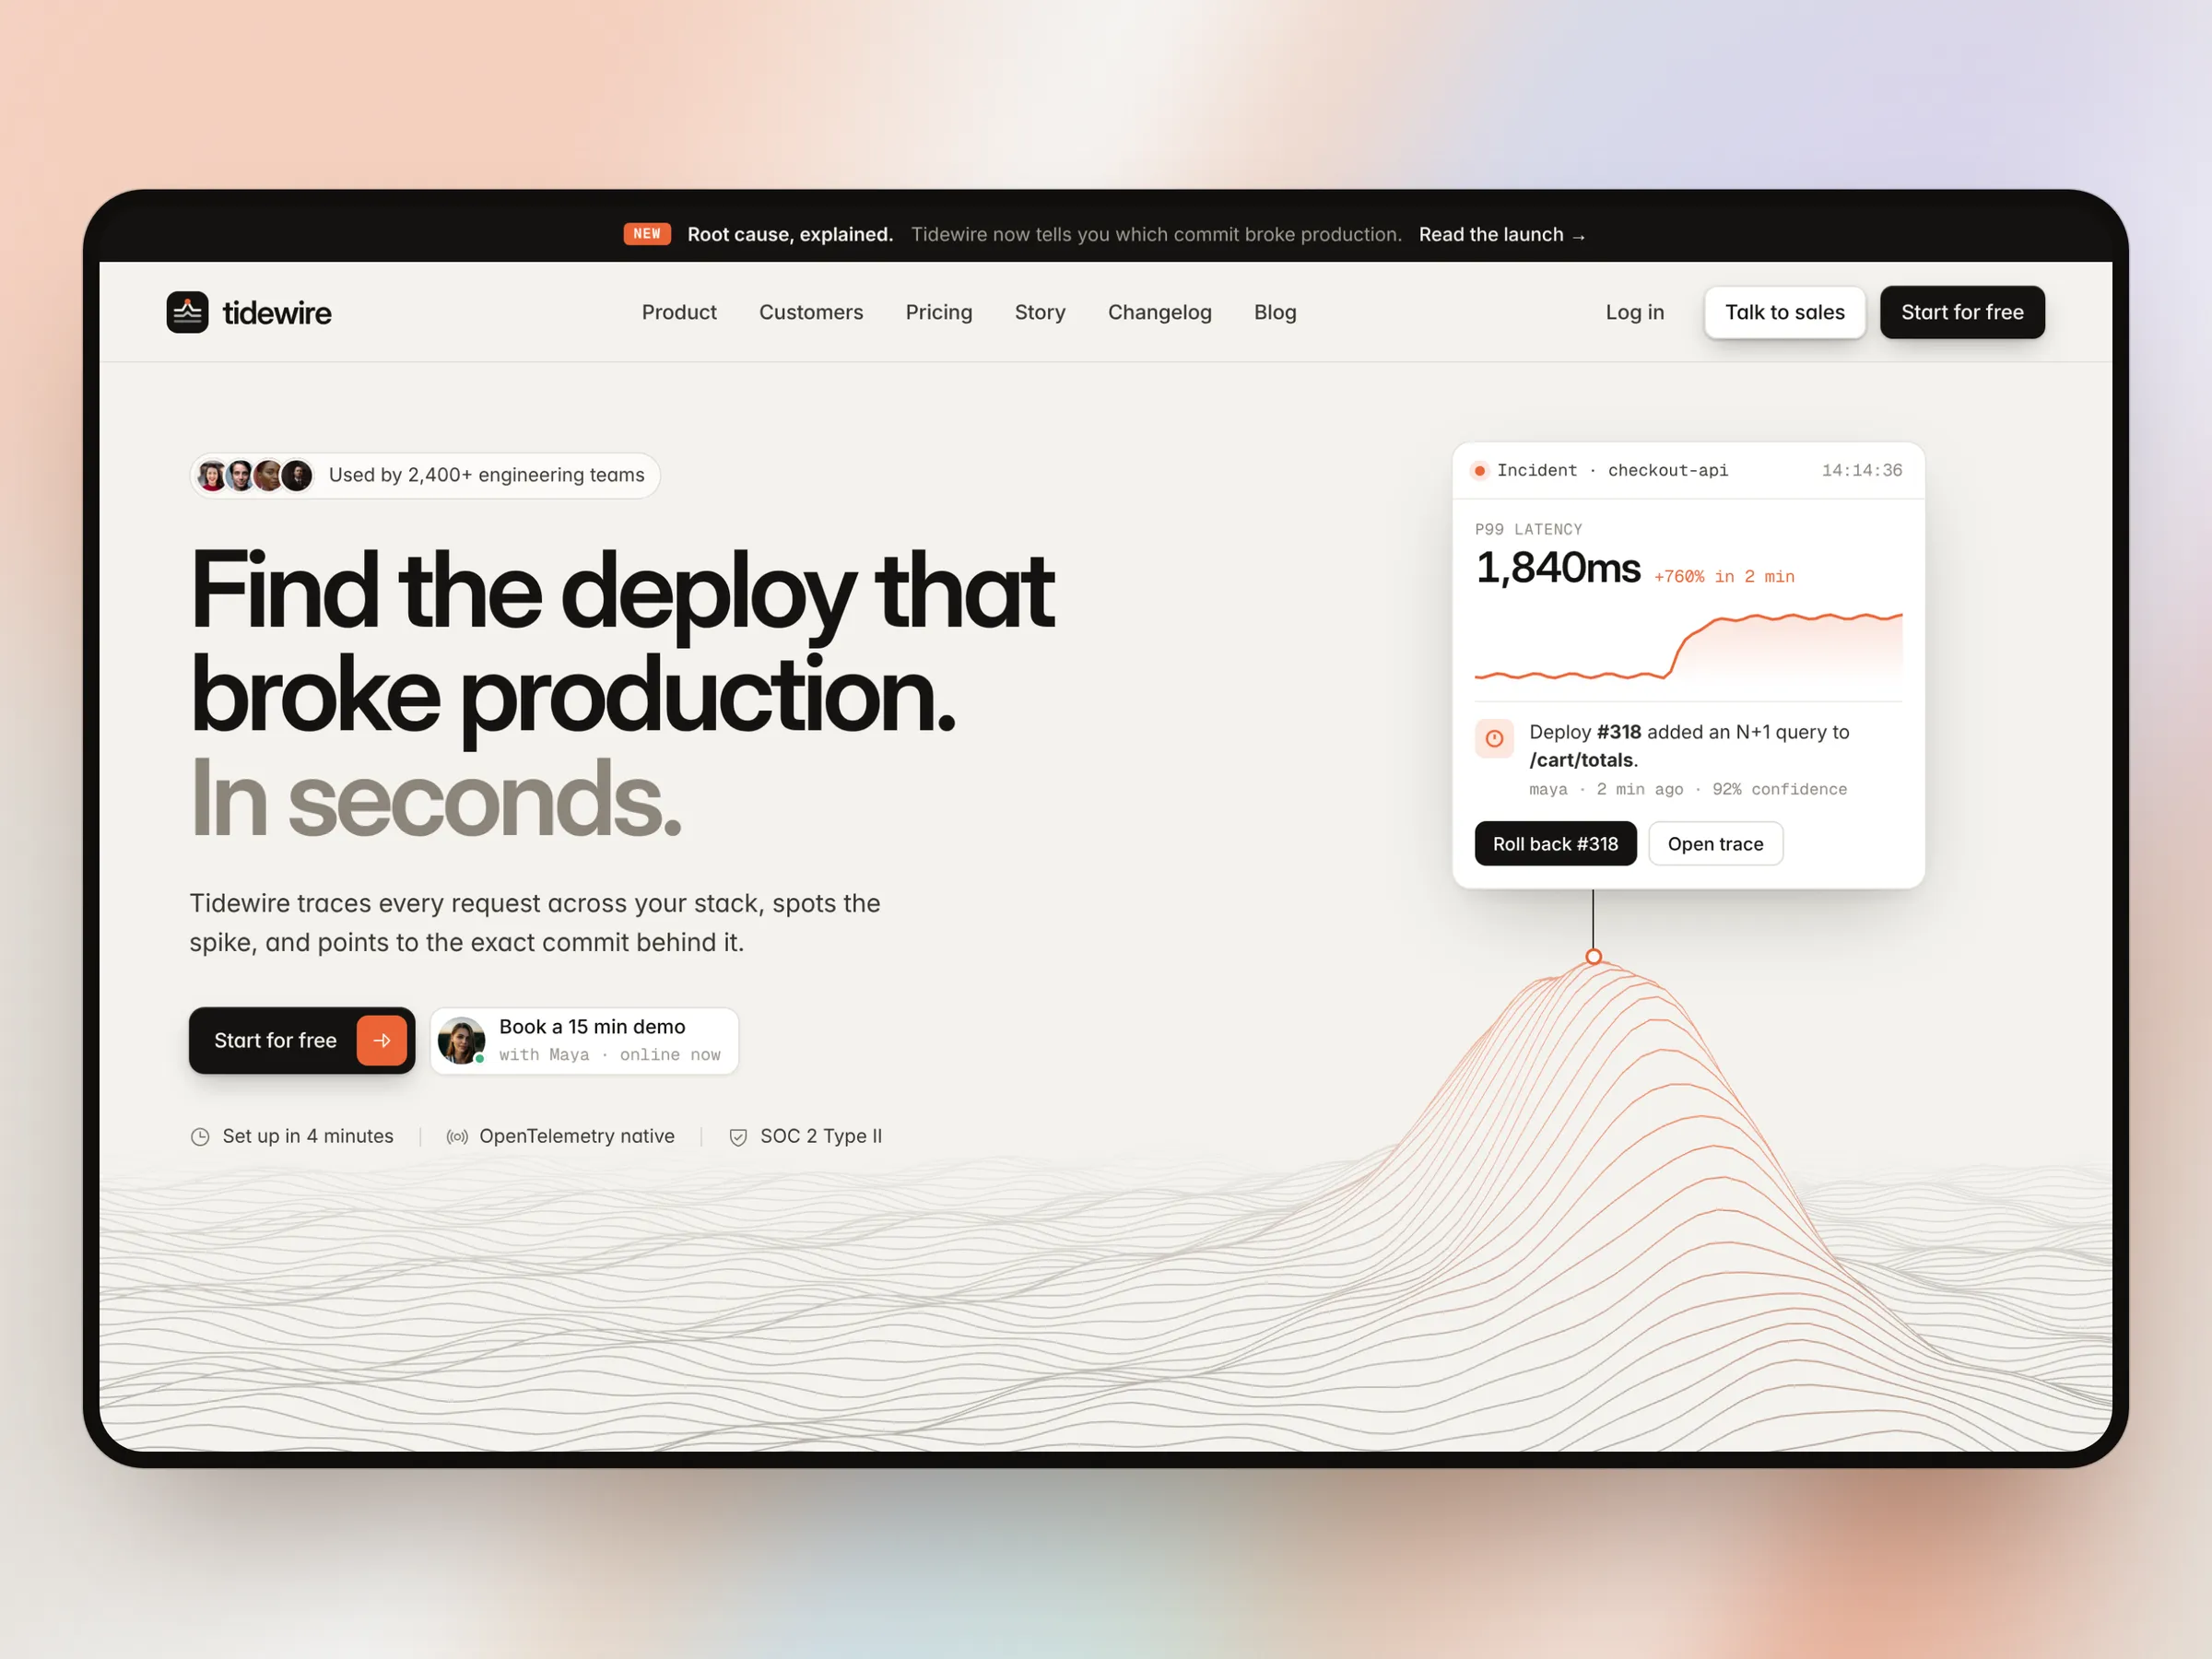
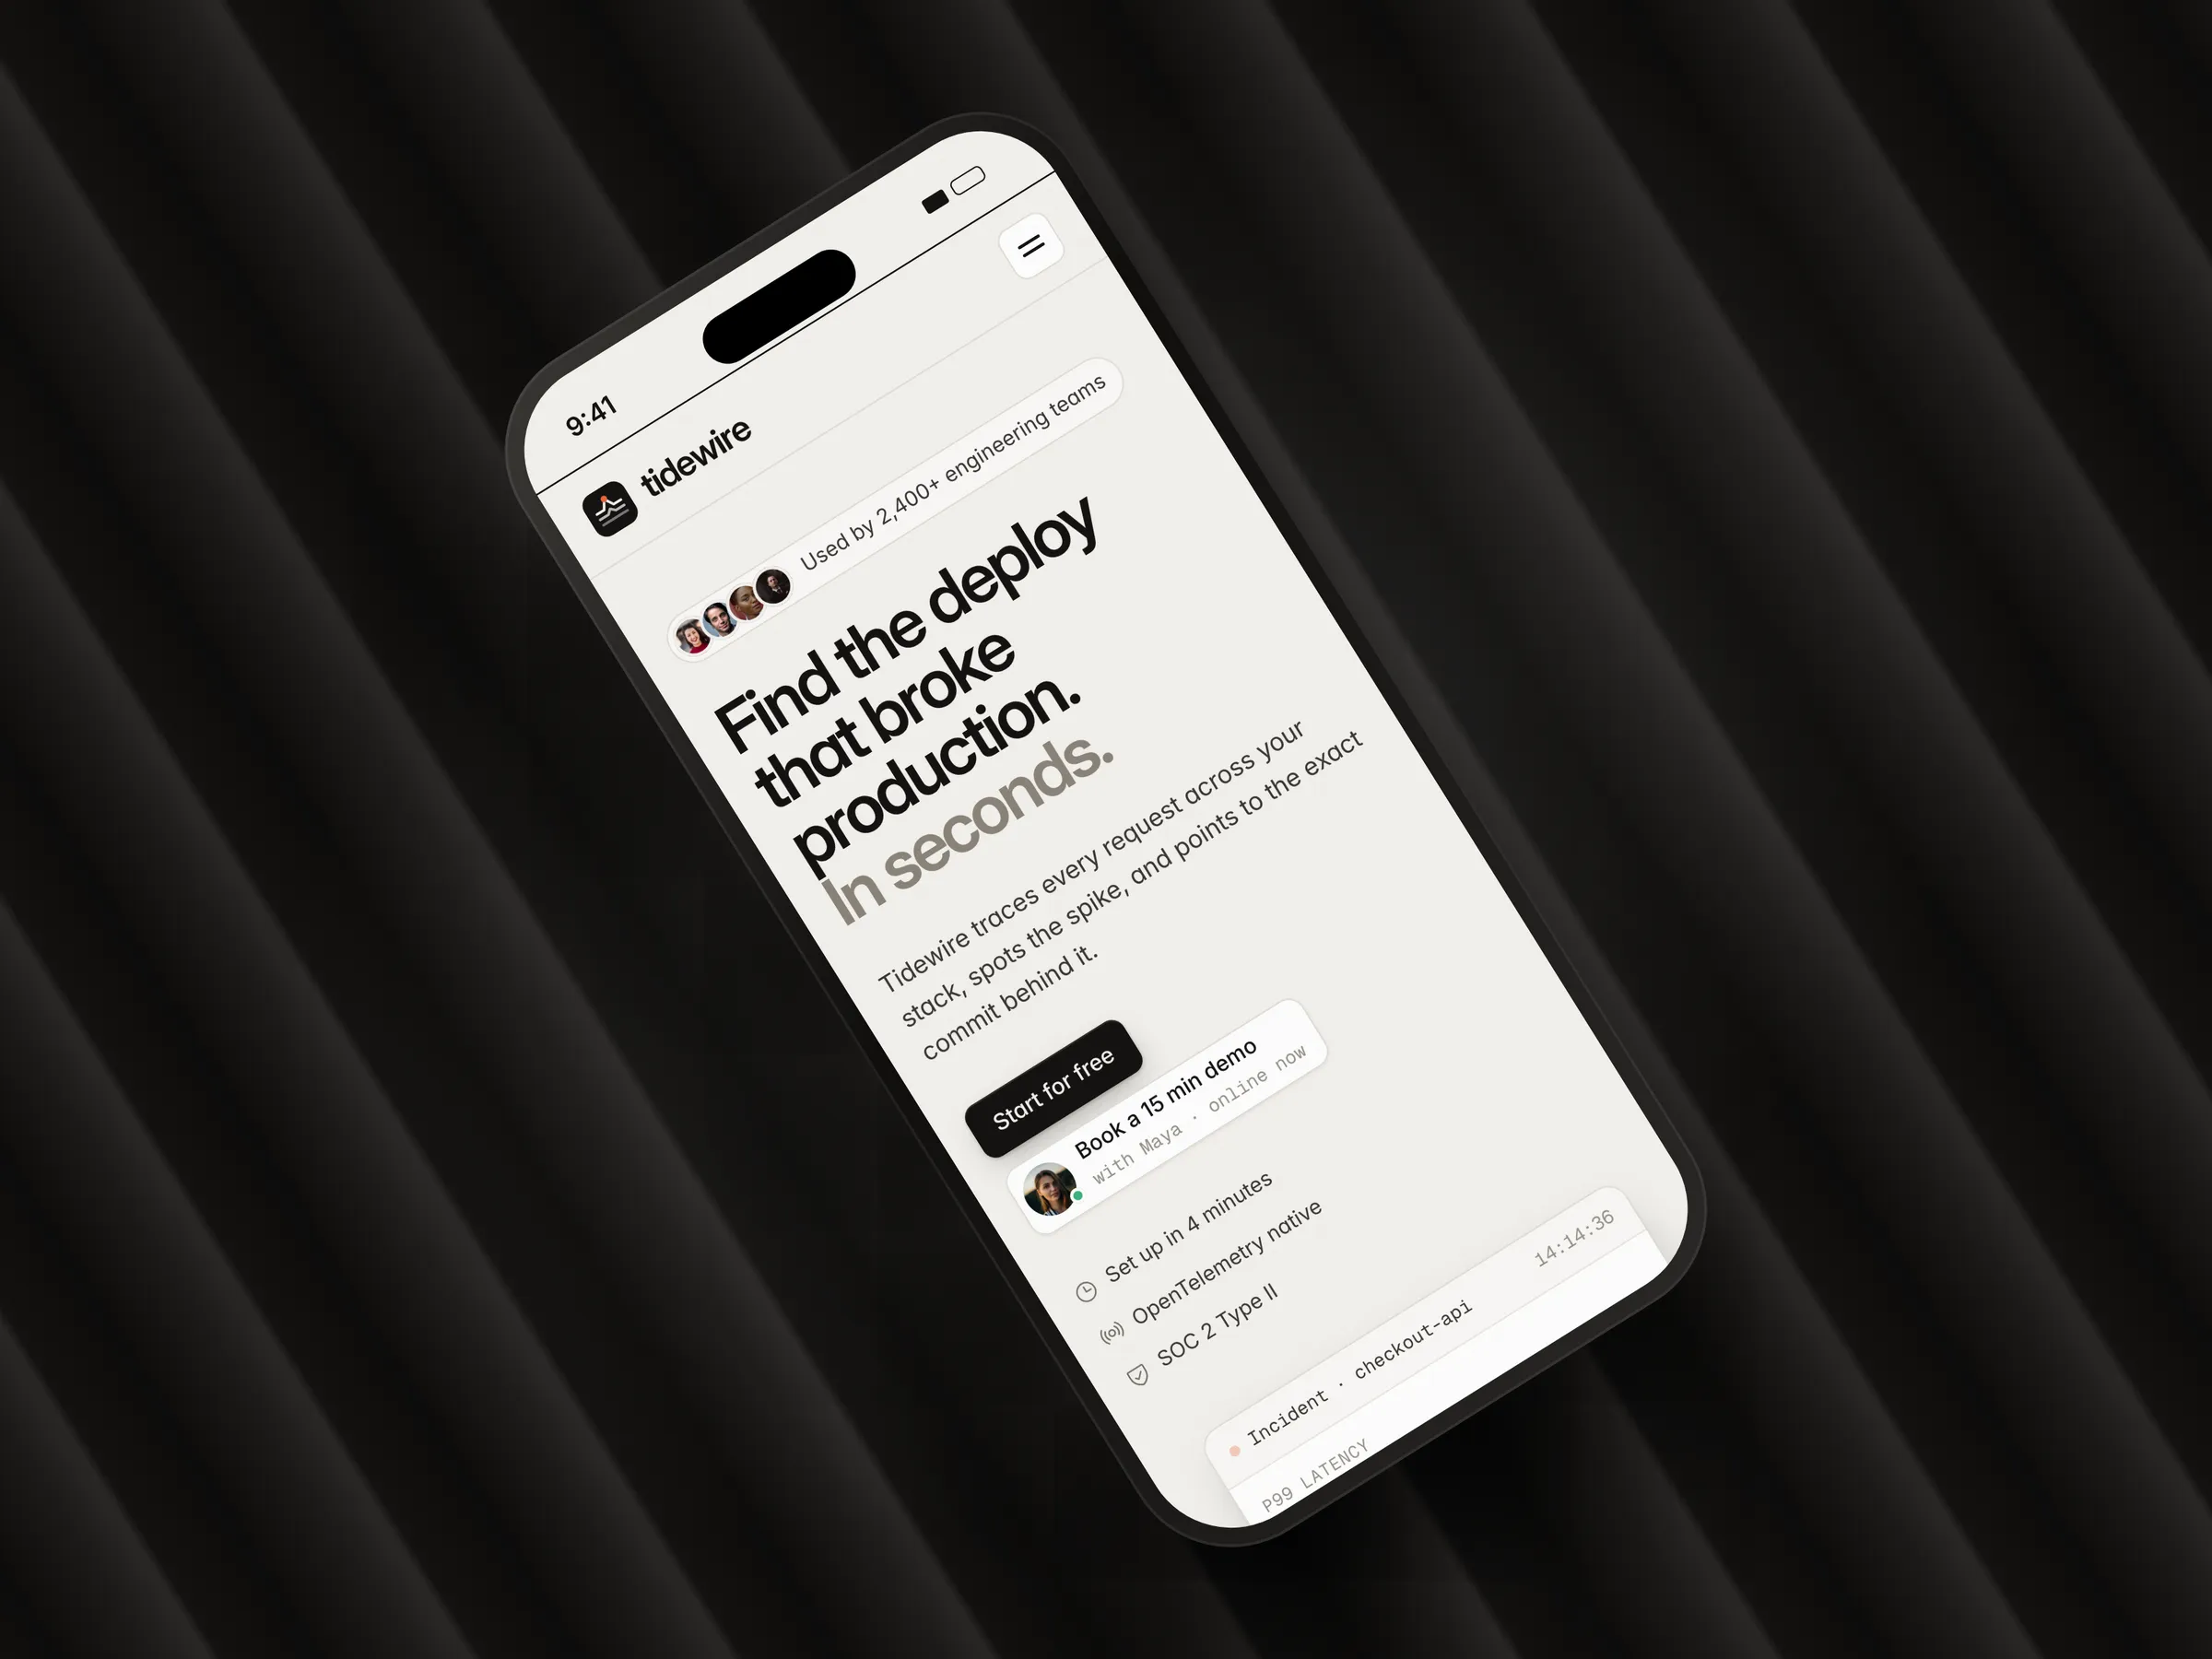
We started from the one moment the product exists for: production breaks. The hero is that moment. A p99 latency spike rises out of a landscape of request lines, and a card on top names the deploy behind it, with a rollback button. Before reading a word, an engineer sees what the tool does.
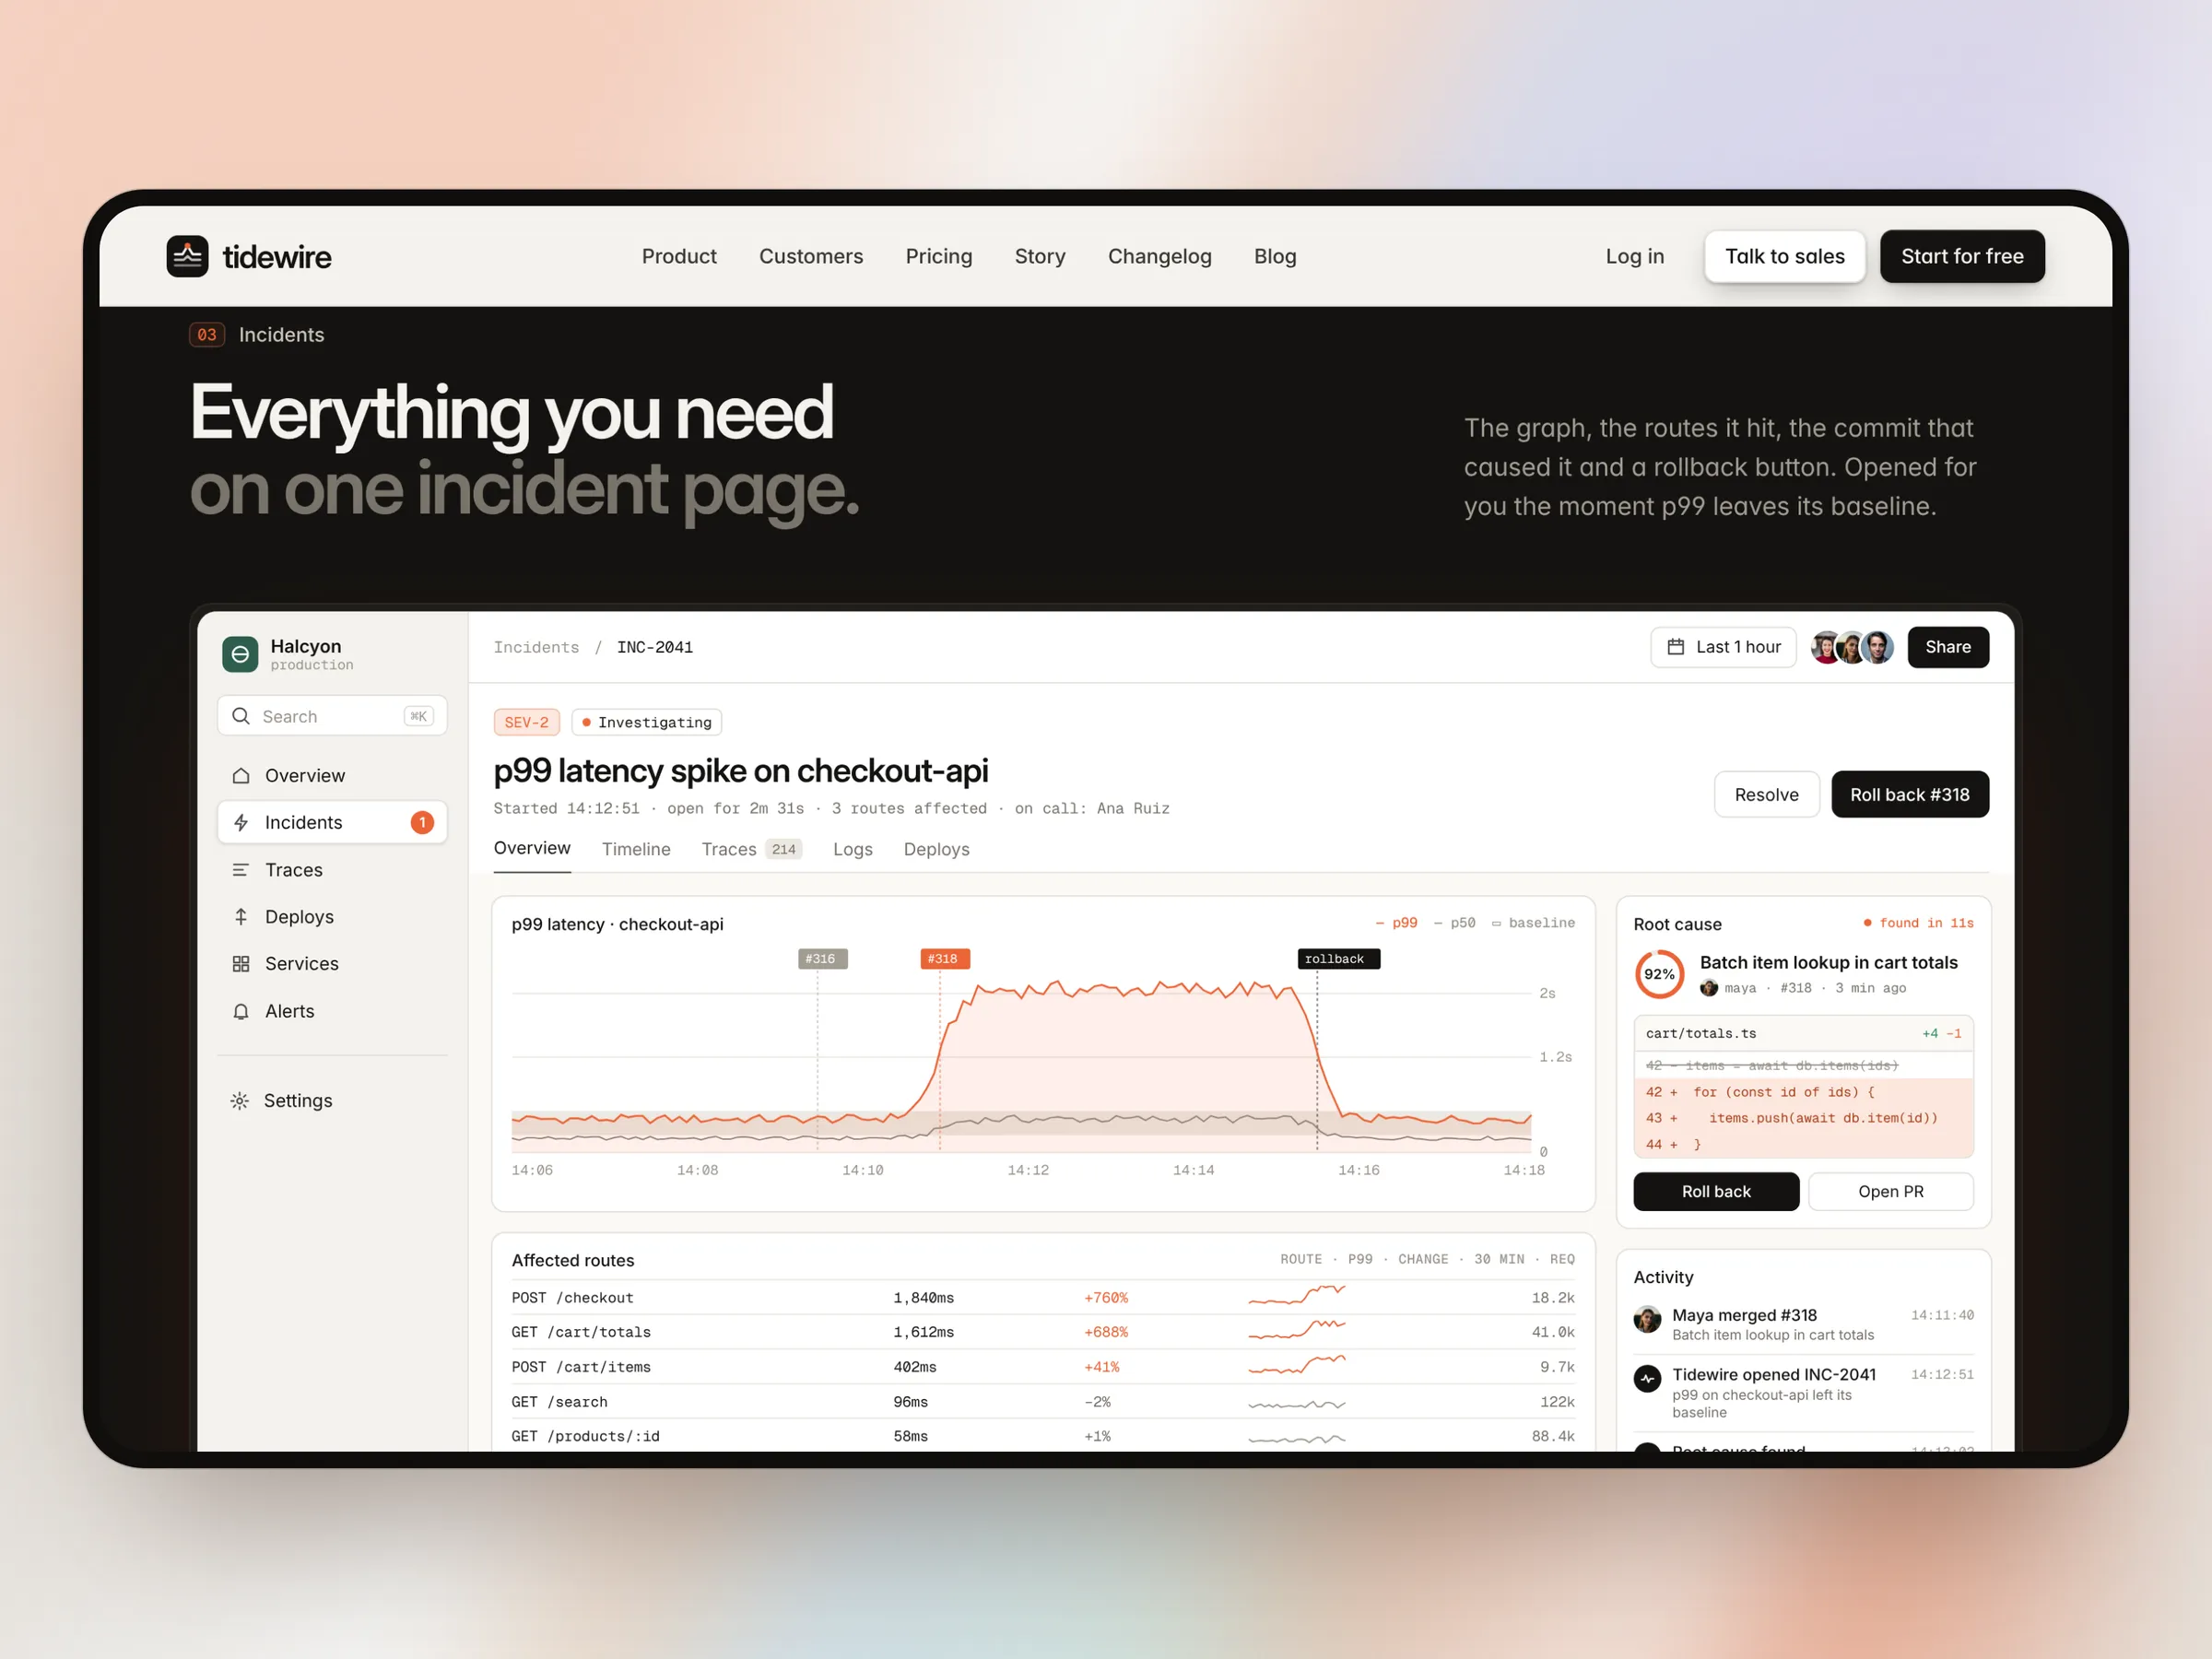
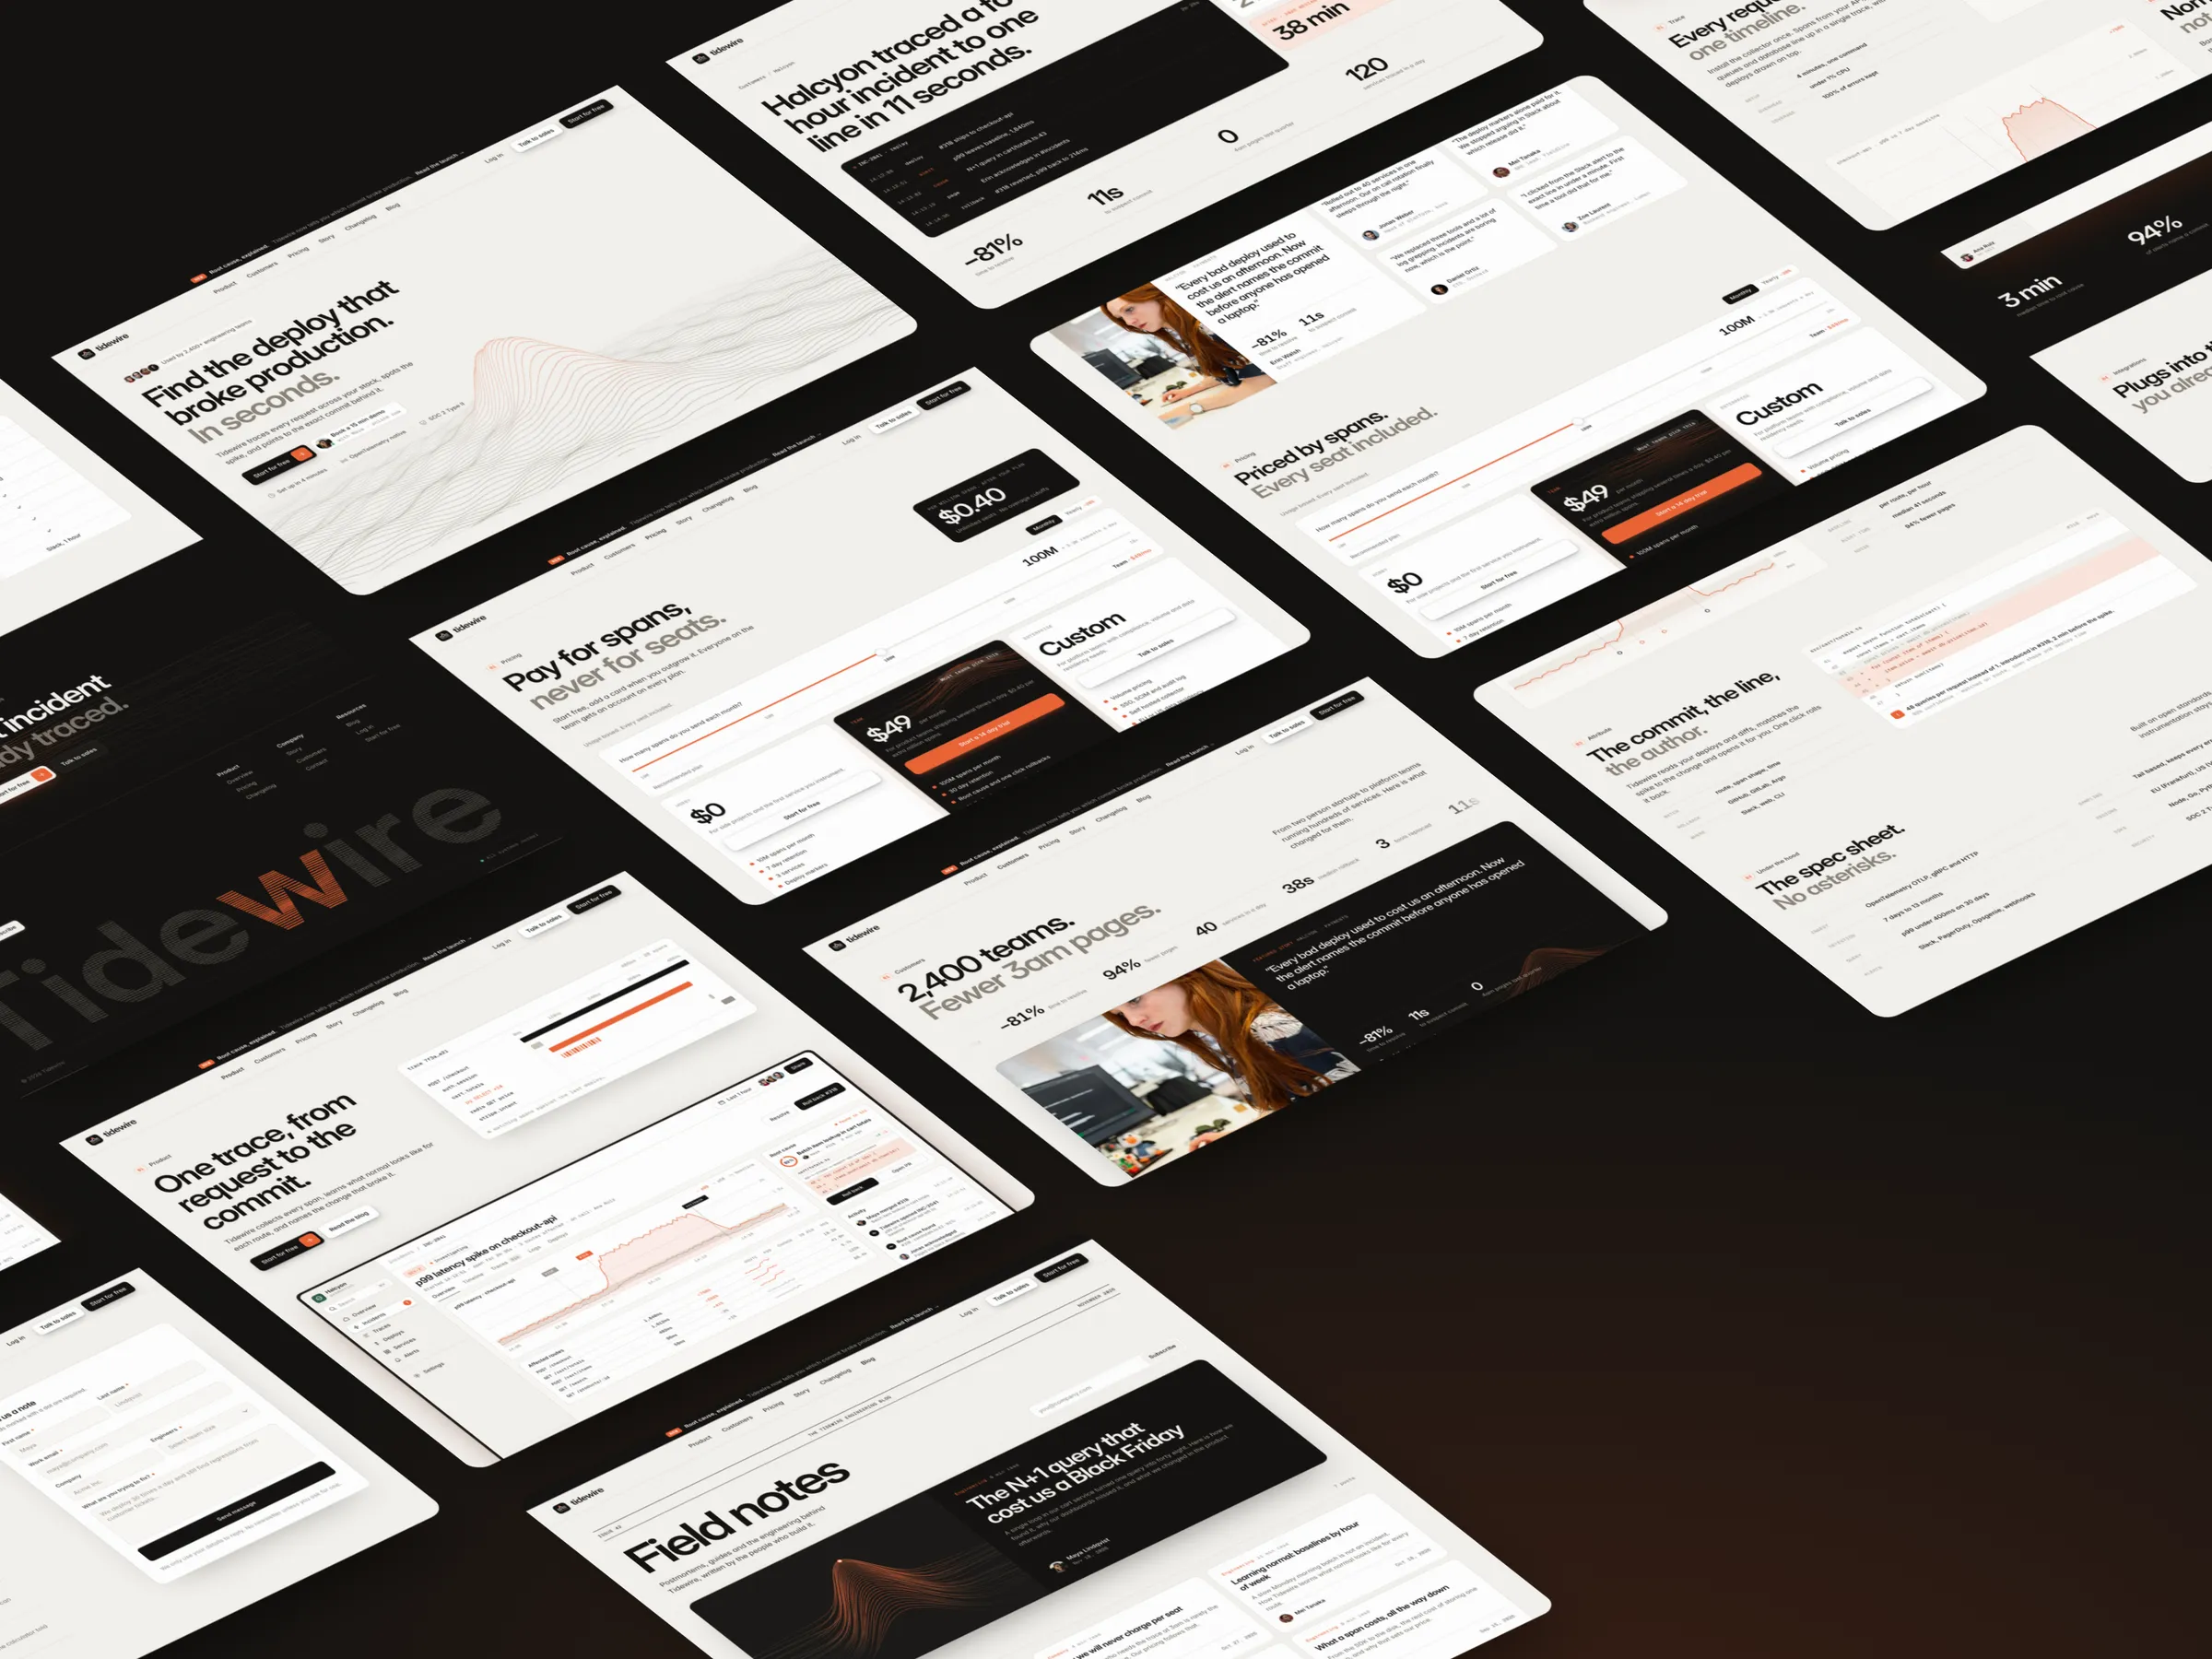
The rest of the page proves it in the order a skeptical buyer asks. One incident page shows the whole product: the graph, the affected routes, the commit and the rollback. Then pricing in plain terms, a customer story, the changelog and the trust details engineers check for, like OpenTelemetry and SOC 2. Every section has a product moment instead of an abstract illustration.
We designed it in Figma and built it in Framer, from desktop to phone, and published it as a template, so the same structure can be shipped for a real devtool in days.
Building a devtool, an API or infrastructure product? Send us your site and we'll show you what your "moment" is, free.
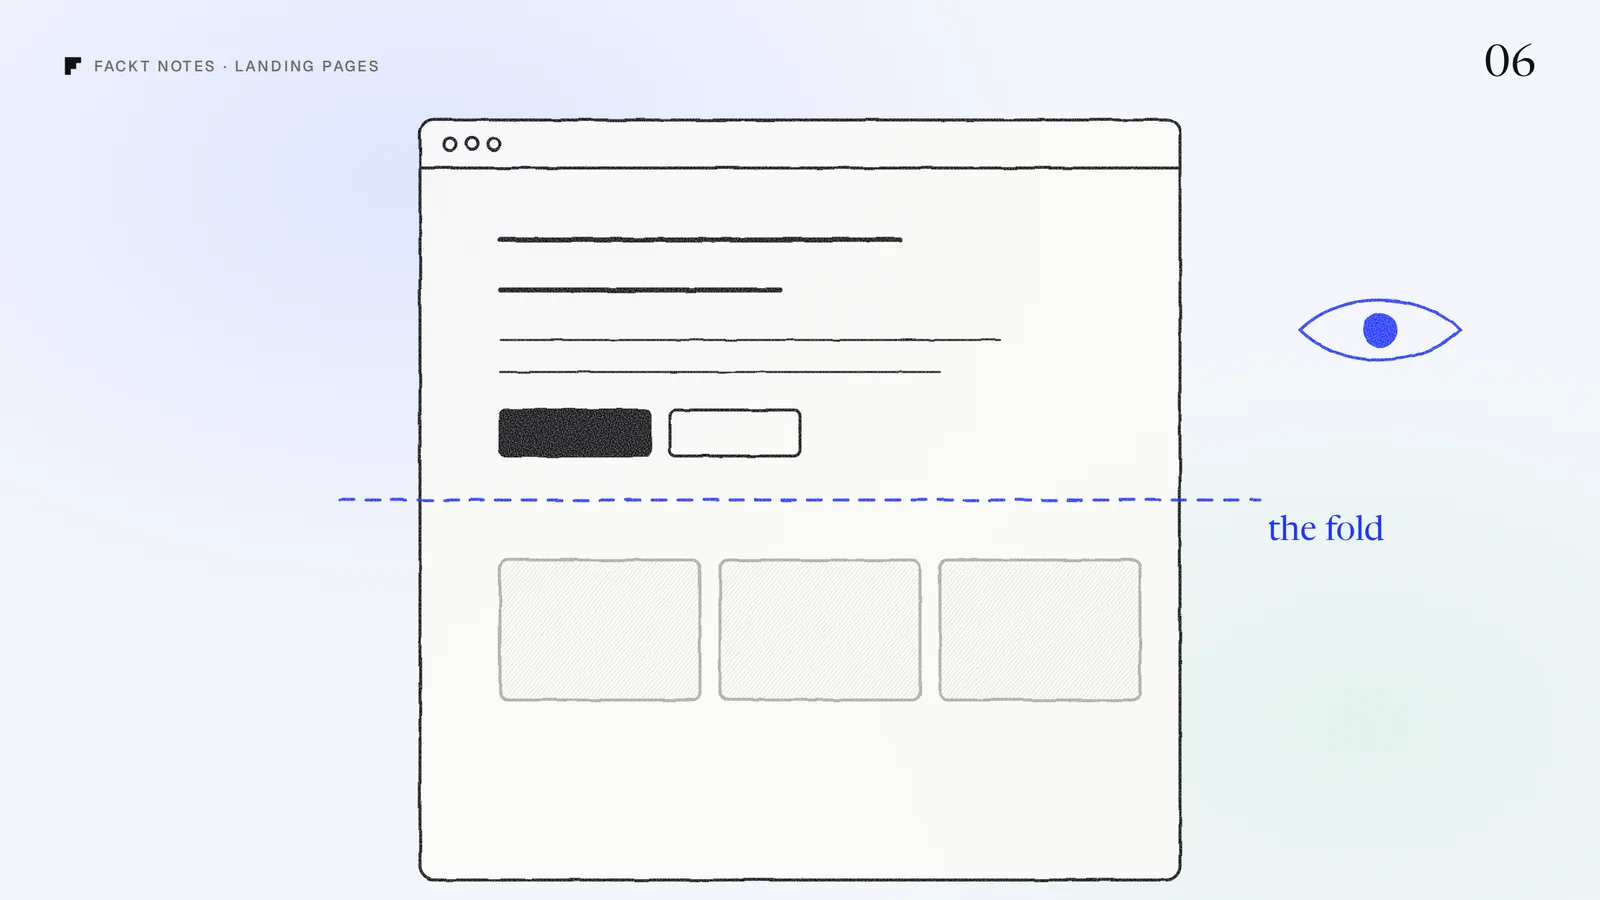 Related noteWhat a SaaS landing page needs above the fold Read →
Want results like this?
Book a free 30 minute strategy call with Dom, or get a free audit of your product first.